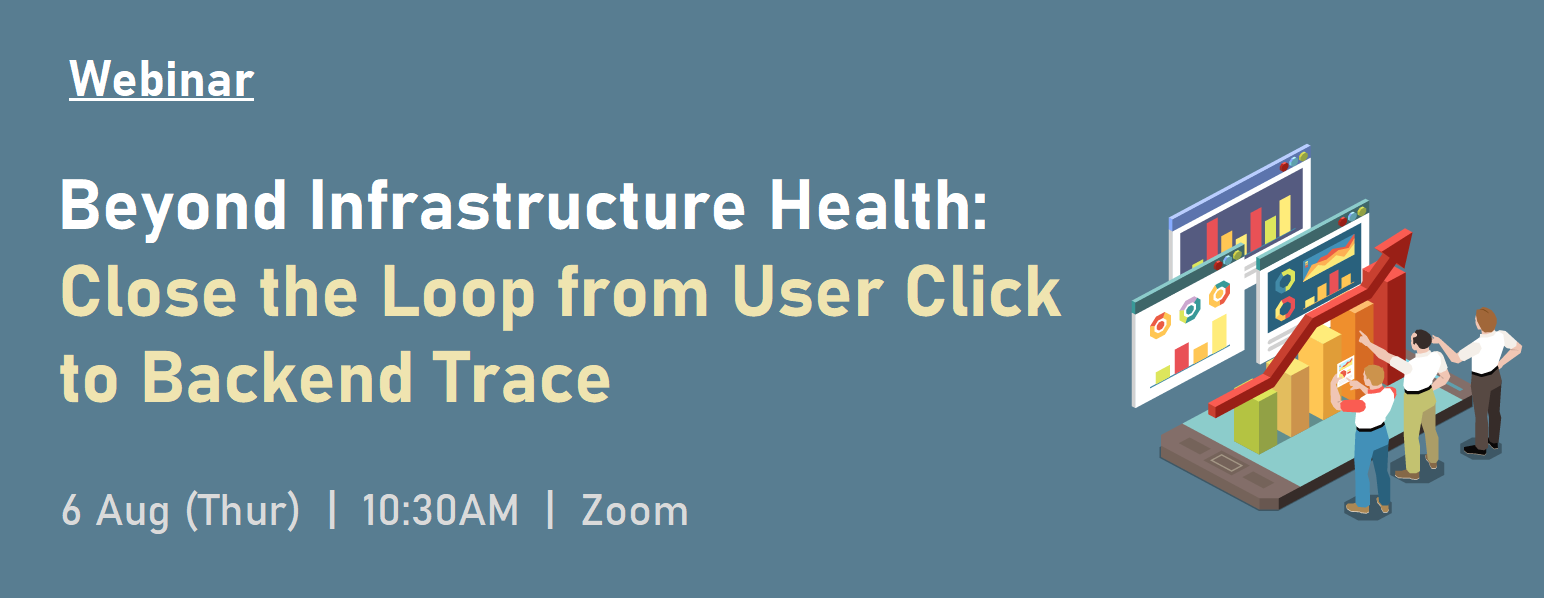
Webinar Details:
Date:
6 Aug, 2026 (Thur)
Time:
10:30AM - 12:00PM (HKT)
(Webinar opens from 10:20AM for sign-in)
Format:
Live Online Webinar
[Link will be provided upon registration]
Language:
Cantonese with English terminology
Enquiry: marketing@systex.com.hk
|
|
Master Digital Experience Monitoring with our next-level Dynatrace technical walkthrough
Infrastructure and service health metrics tell you if your systems are running, but they don't always tell you if your users are actually having a good experience.
Building on the foundation laid in Dynatrace 101, it is time to shift our focus to the frontend. We are excited to invite you to our upcoming technical session: Closing the Loop: Digital Experience from the User's Click to the Backend Trace.
Join us as we move beyond basic infrastructure monitoring to capture the complete picture of application performance.
What to Expect: The Technical Walkthrough
We will dive deep into how Dynatrace connects client-side anomalies to backend root causes. You will learn how to identify the exact scope of user impact, analyse frontend behaviour in real-time, and monitor application availability across all your digital channels.
Closing the Loop: Stop guessing what went wrong on the client side. See exactly how to trace a stalled user transaction directly back to the offending microservice, infrastructure bottleneck, or database call.
Agenda
1. Introduce Digital Experience
What is Digital Experience and why it matters
Key concepts: application, user action, user event, user session, performance, and errors
2. RUM, Session Replay, and Synthetic Monitoring
What is RUM
How RUM captures actual user experience
How Session Replay helps visually understand user behavior
How Synthetic Monitoring validates critical journeys proactively
3. Waterfall analysis
Reading frontend timing, resources, XHR/fetch calls, and third-party impact
Identifying whether slowness comes from frontend, backend, network, or external dependencies
4. End-to-End (from digital touchpoints to backend) investigation
Connecting frontend user actions to backend traces and services
Investigating slow page loads and user actions across the full request path
Identifying whether frontend errors are related to backend failures
5. Live Demonstration
From RUM application overview to user session
From waterfall analysis to backend trace, service, and infrastructure
Using DQL only when deeper filtering or analysis is needed
6. Dynatrace Assist
Using natural English to generate DQL queries, summarize findings, and guide investigation
Reserve your seat today and start turning observability into a competitive advantage.
|